Getting Started with Kaluza: Loading Files and Creating Plots
Here we will show you how to open Flow Cytometry Standard (FCS) files in Kaluza* and how to start building your own gating hierarchy using basic plot types such as histograms and biaxial plots. Please refer to the Instructions for Use (IFU) for detailed explanations of features and functions. This video does not replace the IFU.
Loading Files
There are multiple ways to import files into Kaluza Analysis. The preferred approach, which can be done from the Welcome Screen or when already working in the software, is provided in the instructions below. The option presented here as well as additional options are discussed in detail in the Kaluza Analysis Instructions for Use. Kaluza Analysis can load any listmode file that is compliant with the FCS standard up through version 3.1.
- Locate the files you wish to analyze.
- Select the files and drag them into the Kaluza Analysis List and release the mouse button. By default, the original file names appear in the Data Set column of the Analysis List.
Creating Basic Plots and Gates
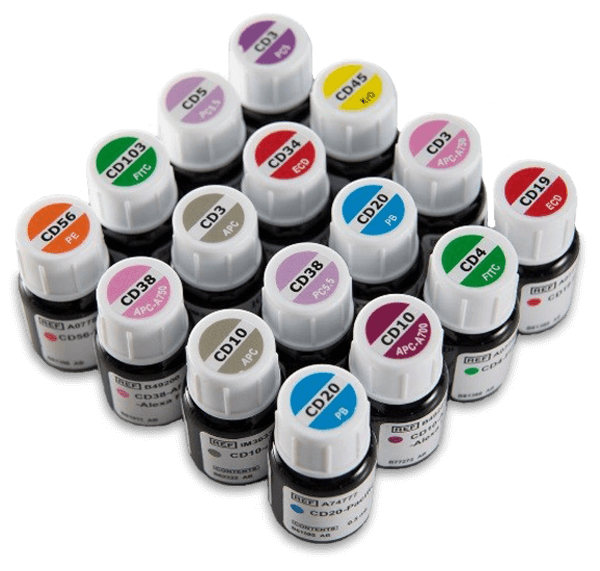
Data for this demonstration was generated using a normal whole blood sample stained with DURAClone IM Phenotyping Basic Antibody Panel, acquired on a CytoFLEX LX flow cytometer and analyzed using Kaluza Analysis Software.
Creating Basic Plots
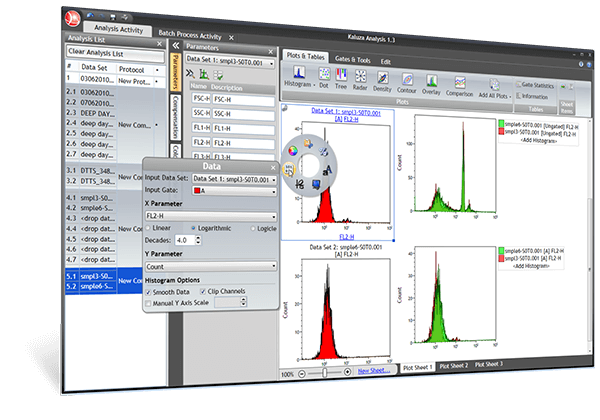
To customize your Protocol, Kaluza Analysis provides several plot and table types, each of which can be customized for data presentation. Instructions for adding and configuring biaxial dot plots and histogram plots are provided below. For more detailed instructions and instructions for other plot types, please refer to the Kaluza Analysis Software Instructions for Use.
- To add a plot, select the Plots & Tables ribbon tab. To add the plot to the bottom of the analysis, select the icon corresponding to dot plot or histogram. To add the plot to a specific location on the sheet, click the icon for dot plot or histogram, drag it to the location you prefer and release the mouse button.
- Select the <Choose a parameter> hyperlink at the X or Y Axis of the plot and select the parameter you would like to display from the list.
- By selecting parameters it is also possible to switch from histogram to biaxial plot and vice versa.
- To update the coloring associated with a plot, access the Radial Menu and select Coloring. This allows you for example to switch between gate and density coloring and to change the color of bands in Contour and Density plots.
NOTE: by default the parameter list will include all parameters (up to 64) contained in the fcs file. Refer to the Editing Loaded Parameters section of the Kaluza Analysis Instructions for Use to learn how to unload parameters that are not required for your data analysis. If data seems to be missing from a plot, or if only a small number of events appear adjust the number of displayed decades or Display Min/Max or Auto options by accessing Radial Menu > (Data). You can also use the Zoom tools in the Gates and Tools ribbon tab to select the plot area to be displayed.
Creating Basic Gates
A gate is used to define a subset of events that will be used for further examination. Kaluza Analysis provides multiple types of gates that enable you to define the exact set of events for additional analysis. In the following section the use of Polygon Gates is described.The Polygon gate allows you to create a gate with up to 128 points; this allows you set up a very specific zone of events to include in your gate. The Polygon gate is available on Dot, Density, Contour, and Radar plots.
- From the Gates & Tools ribbon tab, select the Polygon icon.
- Click your mouse where you wish to begin creating your gate.
- Determine the path you need for your gate and continue clicking your mouse at the location of each direction change. As you draw the gate, a new line will be added each time you click your mouse, and the default gate color will display, working as a guide to show your progress.
- When the gate is completed, double click or select the initial point.
NOTE: A vertex point may be added by mousing over the area to which you want to add the vertex point. When the mouse pointer changes to a hand symbol, click and drag outwards. To delete a vertex point, press the (Ctrl) key and click on the point to be deleted.
Applying Gates to Plots
- Option: To gate a plot using the hyperlink select the hyperlink located at the top of a plot. Select the desired gate from the pop-up menu.
- Option: To gate a plot using the drag/drop method press the Alt key, and, while pressed, select the gate you wish to use as the input gate for a plot. Drag the gate onto the plot and release your mouse button and Alt key to complete the process.
Kaluza Analysis Software is For Research Use Only. Not for use in diagnostic procedures